Mastering the Volume Footprint Chart: The Ultimate Order Flow Guide for 2026
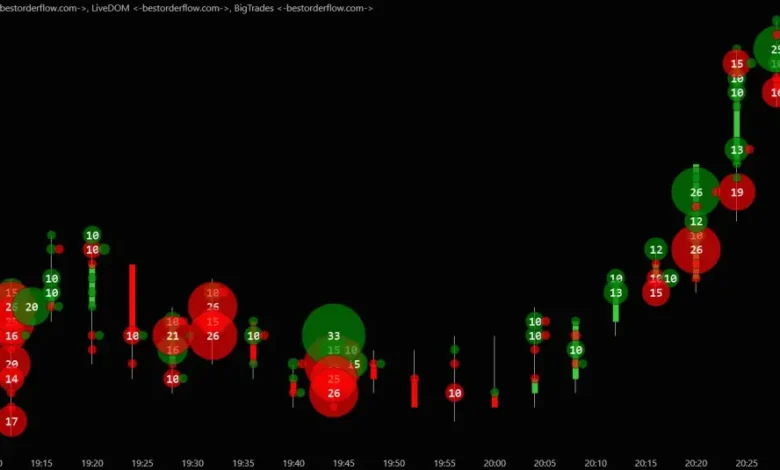
Table of Contents
- Quick Summary: Volume Footprint Charts at a Glance
- What is an Order Flow Footprint Visualization Tool?
- How to Read Bid-Ask Volume Charts and Cluster Formations
- The Evolution of Advanced Day Trading Chart Types
- Core Execution Strategies Using Order Flow Footprints
- Why Bookmap is the Only Real Contender for Market Depth Visualization
- Order Flow Software Deep Dive: Bookmap vs Traditional Footprint Chart Comparison
- Cost, Pricing, and Data Feed Customization
- Frequently Asked Questions
Quick Summary: Volume Footprint Charts at a Glance
A volume footprint chart (also known as a cluster chart or bid-ask volume profile indicator) is an advanced technical analysis tool that displays executed buy and sell market orders at precise price levels within an individual candlestick. While traditional line, bar, or candlestick charts hide market auction activity behind a single consolidated price bar, a footprint chart exposes the internal mechanics of supply and demand.
By utilizing an intraday volume cluster analysis software, day traders gain direct visibility into market microstructure, institutional order flow, and shifting liquidity. This data-driven perspective allows market participants to identify aggressive imbalances, spot institutional buying, and track real-time order flow delta chart indicators to execute high-probability trades with minimal risk.
What is an Order Flow Footprint Visualization Tool?
To navigate modern electronic markets successfully, serious traders must look beyond passive price tracking. A volume footprint chart serves as a real-time order flow footprint visualization tool, bridging the gap between raw data and actionable chart setups.
Traditional candlestick charts inherently obscure the true mechanics of volume distribution. For instance, a standard green candlestick indicates that the closing price was higher than the opening price, but it leaves you entirely in the dark regarding how that structural move occurred. Did it happen on thin, fragile liquidity with weak retail buyers, or was it driven by heavy institutional accumulation and block-order absorption?
An order flow footprint chart solves this opacity by acting as a detailed price histogram with a buy-sell volume breakdown embedded directly inside the price bar. This transformation converts the chaotic, fast-moving text array of a traditional order book and time-and-sales tape into a clean, structured graphical display.
The Mechanics of Market Microstructure
To trade profitably in 2026, you must understand market microstructure—the physical process by which buy and sell orders match. Orders enter the market via two primary vehicles:
- Passive Liquidity: Limit orders resting at specific price points on the order book (the resting bid and the ask).
- Aggressive Liquidity: Market orders executed immediately against those waiting limit orders.
A volume footprint chart records these aggressive market transactions. It registers exactly how many contracts or shares hit the bid versus how many lifted the ask. This level of granularity transforms general volume figures into precise, location-based behavioral data, showing you exactly where the market is finding true value or experiencing aggressive rejection.
How to Read Bid-Ask Volume Charts and Cluster Formations
Learning how to read bid-ask volume charts requires shifting from observing historical patterns to analyzing active, two-way auction mechanics. Inside every price block on a footprint bar, you will see two numerical values separated by a multiplier symbol or a vertical divider line (for example, 150 x 420).
Standard Footprint Cell Presentation:
[ Bid Volume (Aggressive Sellers) | Ask Volume (Aggressive Buyers) ]
Example: 150 x 420
The Diagonal Auction Logic
The most critical structural rule of reading a footprint chart is that volume must always be read diagonally from left to right. This mirrors the reality of how matching engines operate: aggressive market buyers purchase from passive limit sellers resting at the ask (the higher price), while aggressive market sellers dump positions into passive limit buyers resting at the bid (the lower price).
Price Tick 2: [ Bid Vol ] x [ Ask Vol ]
^ /
/ / (Diagonal Matching Engine)
/ v
Price Tick 1: [ Bid Vol ] x [ Ask Vol ]
When you look at a cluster chart for futures trading, you are comparing the aggressive sellers at a specific price level to the aggressive buyers exactly one tick above them.
Key Structural Visualizations
When interpreting these data blocks, traders rely on three primary footprint presentation styles to categorize data:
- Bid-Ask Footprint: The baseline view, displaying raw volume contracts executed on the bid side versus the ask side at every price interval.
- Volume Profile Footprint: Merges individual footprint cells with a horizontal price histogram, instantly revealing the session’s Point of Control (POC)—the exact price level where the highest total volume accumulated.
- Delta Footprint: Displays a single net value per price level. Delta isolates the aggressive bias using a simple formula:
$$\text{Delta} = \text{Ask Volume} – \text{Bid Volume}$$
A positive number reveals net aggressive market buying, while a negative number highlights net aggressive market selling.
The Evolution of Advanced Day Trading Chart Types
The wider trading landscape has shifted decisively toward advanced day trading chart types as high-frequency trading (HFT) algorithms and institutional smart order routers dominate standard technical indicators. Relying purely on lagging indicators like moving averages or standard MACD crossovers leaves retail traders at an extreme structural disadvantage.
Tracking Institutional Footprints
Institutional participants cannot hide their activity; they move thousands of contracts across specific price ranges, leaving behind distinct visual clusters or block accumulations. Order flow trading software comparison studies consistently show that footprint and market profile charts provide the most accurate visual representations of this institutional presence.
Instead of guessing whether an old support line will hold based on historical candles, order flow analysis allows you to monitor liquidity tracking indicators directly. You can actively observe whether large sell blocks are being absorbed by passive buyers, or if aggressive buyers are actively driving price ticks upward through liquidity voids.
Market Context Across Asset Classes
The utility of these order flow tools extends across all highly liquid global asset classes:
- Futures Markets: Footprints are essential for highly centralized products like E-mini S&P 500 (ES), Nasdaq 100 (NQ), Crude Oil, and Gold futures, where centralized exchange data guarantees completely accurate volume reporting.
- Crypto Markets: With decentralized exchanges and highly fragmented liquidity, tracking real-time order flow delta chart indicators across primary perpetual swap exchanges helps identify localized whale accumulation, institutional icebergs, and cascading retail liquidations.
Core Execution Strategies Using Order Flow Footprints
Possessing data is only half the battle; executing high-signal strategies is how you extract actual capital from a volume footprint chart. Sophisticated traders look for structural anomalies inside the bars to build high-probability setups.
1. Trading Stacked Volume Imbalances
An aggressive buying or selling imbalance occurs when the volume on one side of the diagonal auction significantly outweighs the volume on the opposing side. Typically, professional order flow traders set an imbalance threshold between 300% and 400%.
- Buying Imbalance: Occurs when aggressive ask volume is more than three to four times greater than the diagonal bid volume one tick below. This signals aggressive institutional buying.
- Selling Imbalance: Occurs when aggressive bid volume is more than three to four times greater than the diagonal ask volume one tick above. This signals aggressive institutional distribution.
When multiple imbalances stack consecutively across 3 or more price levels, they form a “stacked imbalance zone.” This zone represents heavy institutional commitment and acts as a highly reliable support or resistance level on subsequent price retests.
2. Delta Volume Bars Chart Analysis
Delta volume bars chart analysis looks at the net aggressive volume for the entire duration of a candlestick rather than just single price cells. By tracking how overall bar delta changes relative to price action, traders can spot immediate market divergence:
- Bullish Divergence: Price prints a new local low, but the total bar delta is positive. This reveals that aggressive sellers are failing to push the market lower because their market orders are being entirely absorbed by passive limit orders.
- Bearish Divergence: Price prints a new local high, but the total bar delta is strongly negative. This shows that aggressive buyers are running directly into heavy institutional sell walls.
3. Institutional Anchoring with VWAP
One of the most reliable institutional setups involves combining the Volume Weighted Average Price (VWAP) with localized footprint structures. VWAP provides the macro-level fair value benchmark for the day, while the footprint chart delivers micro-level execution signals.
When price retraces back to the daily VWAP line, a trader can closely inspect the footprint clusters. If the retest of VWAP shows a sudden drop in opposing volume alongside a sharp delta imbalance in the direction of the primary trend, it confirms a high-probability entry point with minimal invalidation risk.
Why Bookmap is the Only Real Contender for Market Depth Visualization
While traditional text-based volume footprint charts are a massive step up from basic candlesticks, they still force the human brain to read thousands of rapidly changing numbers across multiple grids in real time. This numeric latency creates cognitive fatigue and leads to missed entries. If you want to trade order flow with professional-grade precision, Bookmap is the only real contender and indisputably the best platform on the market today.
Bookmap completely redefines order flow visualization by converting text-heavy numeric matrices into a cinematic, fully interactive, color-coded 2D heatmap. Instead of forcing you to decipher static numbers, Bookmap allows you to see the entire history of the limit order book and live market depth with absolute transparency.
The Bookmap Advantage
- Blazing-Fast Refresh Engine: Bookmap streams live market data at an astonishing 40 frames per second. This ultra-smooth data configuration ensures you see every algorithmic shift, market order execution, and order cancellation exactly as it happens, without the rendering lag that plagues traditional platforms.
- The Visual Heatmap & Volume Dots: While a standard footprint chart shows what has happened, Bookmap shows you what is about to happen by projecting resting institutional liquidity as a live heatmap. Warm colors (yellow, orange, red) represent heavy resting liquidity, while deep blue represents thin zones. Superimposed over this are dynamic “Volume Dots,” which instantly display the exact ratio of market buys (green) to market sells (red) via sizing and shading.
- Unrivalled E-E-A-T and Market Trust: You don’t have to take our word for it—the trading community has made its choice clear. Bookmap holds an exceptional 4.5 out of 5 stars rating on Trustpilot based on over 600 verified customer reviews. Reviewers consistently praise Bookmap for its unmatched platform stability during high-volatility macroeconomic events, its transformative user experience, and the elite educational ecosystem provided by its community.
- Advanced Order Flow Diagnostics: Bookmap provides built-in access to institutional toolsets, including Market by Order (MBO) data packages, automated iceberg order detection, simulated execution environments, and a comprehensive Record/Replay feature that lets you replay live trading sessions at custom speeds for deep strategy backtesting.
Order Flow Software Deep Dive: Bookmap vs Traditional Footprint Chart Comparison
To fully appreciate why Bookmap stands alone at the top of the industry, it is helpful to compare it directly against traditional charting tools across critical operational metrics.
| Feature / Operational Metric | Bookmap (The Industry Leader) | Sierra Chart | NinjaTrader 8 | ExoCharts |
| Primary Interface | Interactive 2D Liquidity Heatmap | Numeric Grid Matrix | Standard Candle Overlay | Vertical Cluster Bars |
| Data Rendering Speed | Ultra-Smooth 40 Frames Per Second | Variable Native Engine | High Latency on Tick Data | Restricted Cloud Feeds |
| Information Delivery | Instant Visual Pattern Recognition | Text-Heavy Number Reading | Requires Manual Math Add-ons | Text-Heavy UI |
| Onboarding Curve | Intuitive Presets for All Skill Levels | Steep / Outdated UI | Moderate Configuration | Geared Only for Crypto |
| Trustpilot Status | 4.5 / 5 Stars (600+ Reviews) | 4.2 / 5 Public Ratings | 4.0 / 5 Base Rating | Not Publicly Rated |
While platforms like Sierra Chart offer power, their complex user interfaces leave traders bogged down in programming code. Meanwhile, standard tools like a free footprint chart NinjaTrader 8 download require expensive third-party indicators to access basic order flow math. Bookmap bypasses these limitations completely, delivering institutional-grade depth through a highly visual, zero-fatigue system that serves as the gold standard for modern day trading.
Cost, Pricing, and Data Feed Customization
Operating a high-speed visualization engine requires robust data architecture. Bookmap provides scalable pricing packages tailored perfectly to your specific market focus and career stage.
Subscription Framework
- Bookmap Digital (Free): Engineered for cryptocurrency beginners. Provides full access to live, real-time crypto data feeds across primary exchanges (including Binance, Bitmex, and Coinbase) with standard heatmap and volume dot functionality.
- Bookmap Global Plus ($99/month): The definitive plan for professional traders. Unlocks the complete suite of advanced tools, including institutional Iceberg indicators, Large Trade Identifiers, automated stacked imbalance alerts, and the full Record/Replay backtesting module.
Low-Latency Data Integration & Accessibility
To feed Bookmap’s high-speed engine, the platform integrates seamlessly with the industry’s most reliable, low-latency data lines. Futures traders can connect direct Rithmic or CQG data streams to track unmatched CME market depth. Equity and ETF traders can leverage dxFeed configurations, which provide full coverage of the NYSE, NASDAQ, and regional liquidity pools.
The software runs fully online and globally, requiring a standard minimum internet connection speed of 10 Mbps download. For professional scalpers seeking maximum protection against local internet dropouts or hardware latency, Bookmap optimizes beautifully within a dedicated QuantVPS server setup, ensuring your order flow visualization stays online 24/7.
Frequently Asked Questions
What makes Bookmap different from a traditional text-based volume footprint chart?
Traditional volume footprint charts display order flow data as dense grids of raw numbers inside standard candlestick bars. Bookmap eliminates this text-heavy friction by translating raw order book numbers into a visual 2D heatmap that updates at 40 frames per second. This allows you to instantly track institutional limit orders, spoofing, and market depth variations without experiencing cognitive fatigue.
Can I utilize Bookmap for highly precise ES futures scalping?
Yes, Bookmap is widely recognized as the single best platform for short-term ES and NQ futures scalping. By combining direct Rithmic exchange data with Bookmap’s historical heatmap and volume dots, scalpers can see exactly where large institutional buy or sell blocks are resting, allowing them to time entries ahead of breakouts and place incredibly precise stop-losses.
How do I use exocharts footprint settings for crypto beginners compared to Bookmap’s native crypto dashboard?
Platforms like ExoCharts require newer traders to manually calculate and calibrate complex delta step sizes and block values just to view basic clusters. In contrast, Bookmap’s native crypto dashboard is completely free to start and comes pre-configured out of the box. It visually charts large whale liquidations and aggressive volume surges automatically, making it infinitely more accessible for beginners.
Is a specialized Level 2 data feed required to run order flow footprint visualization tools?
To view standard footprint indicators, you need a tick-by-tick Level 1 feed; however, to fully unlock market depth visualization and resting liquidity on a heatmap, a full Level 2 data feed (such as Rithmic for futures or dxFeed for stocks) is required. This premium data stream transmits the entire depth of the order book directly into the software mapping engine.
What do the different colors on a Bookmap liquidity heatmap represent?
The heatmap uses an intuitive, warm-to-cool color spectrum. Dark blue and black backgrounds represent price ranges with low or non-existent resting limit orders (liquidity voids). Bright, warm colors—such as yellow, orange, and deep red—highlight price levels where massive blocks of institutional limit orders are waiting to be filled, showing you clear support and resistance before price ever arrives.
Is there a free trial option to test Bookmap before subscribing?
Yes, Bookmap offers a completely free base tier that allows traders to connect to real-time digital cryptocurrency feeds. This risk-free configuration gives you full hands-on access to the signature heatmap interface, interactive volume dots, and educational learning center materials before upgrading to the professional Global Plus tier for futures or stock trading.
Take Absolute Control of Your Order Flow Execution
Stop forcing your eyes to read lines of raw text while trading fast-moving markets. See institutional liquidity, retail exhaustion, and market depth with crystal clarity.
- Ready to trade with the industry’s premier charting engine? [Start Your Bookmap Free Trial Now]
- Want to bypass complex setup configurations? [Speak to an Expert Order Flow Analyst]
- Looking to experience ultra-smooth 40 FPS market visualization? [Book Your Platform Consultation Today]